Fill and other sanitizing methods
Real world data can have gaps, bad names, or occur at irregular intervals. The pypond toolkit contains some methods to adjust or sanitize a series of less than optimal data. As with all other mutation operations in pypond, these methods will return new Event objects, new Collections and new TimeSeries as apropos.
Fill
Data might contain missing or otherwise invalid values. TimeSeries.fill() can perform a variety of fill operations to smooth or make sure that the data can be processed in math operations without blowing up.
In pypond, a value is considered “invalid” if it is python None, a NaN (not a number) value, or an empty string.
Usage
The method prototype looks like this:
def fill(self, field_spec=None, method='zero', limit=None)
- the
field_specargument is the same as it is in the rest of the code - a string or list of strings denoting “columns” in the data. It can pointto.deep.valuesusing the usual dot notation. - the
methodarg denotes the fill method to use. Valid values are zero, pad and linear. - the
limitarg places a limit on the number of events that will be filled and returned in the newTimeSeries. The default is to fill all the events with no limit.
Complete sample usage could look like this:
    ts = TimeSeries(simple_missing_data)

    new_ts = ts.fill(field_spec=['direction.in', 'direction.out'],
                     method='linear', limit=6)
Fill methods
There are three fill options:
zero- the default - will transform any invalid value to a zero.pad- replaces an invalid value with the the previous good value:[1, None, None, 3]becomes[1, 1, 1, 3].linear- interpolate the gaps based on the surrounding good values:[1, None, None, None, 3]becomes[1, 1.5, 2, 2.5, 3].
Neither pad or linear can fill the first value in a series if it is invalid, and they can’t start filling until good value has been seen: [None, None, None, 1, 2, 3] would remain unchanged. Similarly, linear can not fill the last value in a series.
The fill_limit arg
The optional arg fill_limit controls how many values will be filled before it gives up and starts returning the invalid data until a valid value is seen again.
There might be a situation where it makes sense to fill in a couple of missing values, but no sense to pad out long spans of missing data. This arg sets the limit of the number of missing values that will be filled - or in the case of linear attempt to be filled - before it just starts returning invalid data until the next valid value is seen.
So given fill_limit=2 the following values will be filled in the following ways:
Original:
    [1, None, None, None, 5, 6, 7]

Zero:
    [1, 0, 0, None, 5, 6, 7]

Pad:
    [1, 1, 1, None, 5, 6, 7]

Linear:
    [1, None, None, None, 5, 6, 7]
Using methods zero and pad the first two missing values are filled and the third is skipped. When using the linear method, nothing gets filled because a valid value has not been seen before the limit has been reached, so it just gives up and returns the missing data.
When filling multiple columns, the count is maintained on a per-column basis. So given the following data:
    simple_missing_data = dict(
        name="traffic",
        columns=["time", "direction"],
        points=[
            [1400425947000, {'in': 1, 'out': None}],
            [1400425948000, {'in': None, 'out': None}],
            [1400425949000, {'in': None, 'out': None}],
            [1400425950000, {'in': 3, 'out': 8}],
            [1400425960000, {'in': None, 'out': None}],
            [1400425970000, {'in': None, 'out': 12}],
            [1400425980000, {'in': None, 'out': 13}],
            [1400425990000, {'in': 7, 'out': None}],
            [1400426000000, {'in': 8, 'out': None}],
            [1400426010000, {'in': 9, 'out': None}],
            [1400426020000, {'in': 10, 'out': None}],
        ]
    )
The in and out sub-columns will be counted and filled independently of each other.
If fill_limit is not set, no limits will be placed on the fill and all values will be filled as apropos to the selected method.
Constructing linear fill Pipeline chains
TimeSeries.fill() will be the common entry point for the Filler, but a Pipeline can be constructed as well. Even though the default behavior of TimeSeries.fill() applies to all fill methods, the linear fill logic is somewhat different than the zero and pad methods. Note the following points when creating your own method='linear' processing chain.
- When constructing a
Pipelineto do alinearfill on multiple columns, chain them together like this rather than passing in afield_specthat is a list of columns:
    Pipeline()
    .from_source(ts)
    .fill(field_spec='direction.in', method='linear')
    .fill(field_spec='direction.out', method='linear')
    .to_keyed_collections()
- If a non numeric value (as determined by
isinstance(val, numbers.Number)) is encountered when doing alinearfill, a warning will be issued and that column will not be processed. - When using streaming input like
Stream, it is a best practice to set a limit using the optional argfill_limit. This will ensure events will continue being emitted if the data hits a long run of invalid values. - When using an unbounded source, make sure to shut it down “cleanly” using
.stop(). This will ensure.flush()is called so any unfilled cached events are emitted.
Rename
It might be necessary to rename the columns/data keys in the events in a TimeSeries. It is preferable to just give the columns/keys the desired names when the Event objects are being instantiated. This is because using TimeSeries.rename() will create all new Event objects and a new TimeSeries as well. But if that is necessary, use this method.
Usage
This method takes a python dict of strings in the format {'key': 'new_key'}. This example:
    ts = TimeSeries(TICKET_RANGE)

    renamed = ts.rename_columns({'title': 'event', 'esnet_ticket': 'ticket'})
will rename the existing column title to event, etc.
Limitations
Unlike other uses of a field_spec to point at a deep.nested.value in pypond, .rename() only allows renaming a ‘top level’ column/key. If the data payload looks like this:
{'direction': {'in': 5, 'out': 7}}
The top level key direction can be renamed but the nested keys in and out can not.
Align
The align processor takes a TimeSeries of events that might come in with timestamps at uneven intervals and produces a new series of those points aligned on precise time window boundaries. A series containing four events with following timestamps:
0:40
1:05
1:45
2:10
Given a window of 1m (one minute), a new series with two events at the following times will be produced:
1:00
2:00
Only a series of Event objects can be aligned. IndexedEvent objects are basically already aligned and it makes no sense in the case of a TimeRangeEvent.
It should also be noted that the emitted/aligned event will only contain the fields that alignment was requested on. Which is to say if you have two columns, in and out, and only request to align the in column, the out value will not be contained in the emitted event.
Usage
The full argument usage of the align method:
ts = TimeSeries(DATA_WITH_GAPS)
aligned = ts.align(field_spec='value', window='1m', method='linear', limit=2)
field_spec- indicates which fields should be interpolated by the selectedmethod. Typical usage of this arg type. If not supplied, then the default fieldvaluewill be used.window- an integer and the usuals/m/h/dnotation like1m,30s,6h, etc. The emitted events will be emitted on the indicated window boundaries. Due to the nature of the interpolation, one would want to use a window close to the frequency of the events. It would make little sense to set a window of5hon hourly data, etc.method- the interpolation method to be used:linear(the default) andhold.limit- sets a limit on the number of boundary interpolated events will be produced. Iflimit=2, window='1m'and two events come in at the following times:
0:45
3:15
That would normally produce events on three window boundaries 1:00, 2:00 and 3:00 and that exceeds the limit so those events will have None as a value instead of an interpolated value.
Fill methods
Linear
This is the default method. It interpolates differential values in Event objects on the window boundaries using a strategy like this:
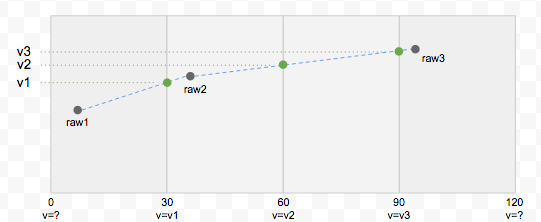
The green points are the events that will be produced by the linear fill method by interpolating the raw points. It also shows why it makes little sense to use a window significantly larger than the frequency of the events. When the window is set too wide for the data, many of the points in the middle of the window will be disregarded since the generated points are interpolated from the last event in the previous window and the first one in the current window.
Hold
This is a much simpler method. It just fills the selected field(s) with the corresponding value from the previous event.
Rate (derivative)
This generates a new TimeSeries of TimeRangeEvent objects which contain the derivative between columns in two consecutive Event objects. The start and end time of the time range events correspond to the timestamps of the two events the calculation was derived from.
The primary use case for this was to generate rate data from monotonically increasing SNMP counter values like this:
TimeSeries(RAW_COUNTERS).align(field_spec='in', window='30s').rate('in')
This would take the raw counter data, do a linear alignment on them on 30 second window boundaries, and then calculate the rates by calculating the derivative between the aligned boundaries.
However it is not necessary to align your events first, just calling .rate() will generate time range events with the derivative between the consecutive events.
Usage
The method prototype:
def rate(self, field_spec=None, allow_negative=True)
field_spec- indicates which fields should be interpolated by the selectedmethod. Typical usage of this arg type. If not supplied, then the default fieldvaluewill be used.allow_negative- if left defaulting toTrue, then if a negative derivative is calculated, that will be used as the value in the new event. If set toFalsea negative derivative will be set toNoneinstead. There are certain use cases - like if a monotonically increasing counter gets reset - that this is the desired outcome.